 By Dan Wismer, GIS Analyst
Backed by peer-reviewed research, GBtools were developed to help support grizzly bear conservation efforts and land management decisions. GBtools consist of a series of python scripts that accept user-input and are designed to run in ArcMap. As old code is refactored and new add-ons developed, GBtools have evolved to narrow down the question resource managers ask the most—how does a proposed development project affect grizzly bear habitat? The Habitat States Tool offers a great solution to this question where useful GIS products are generated to help view the landscape from the eyes of a grizzly bear.
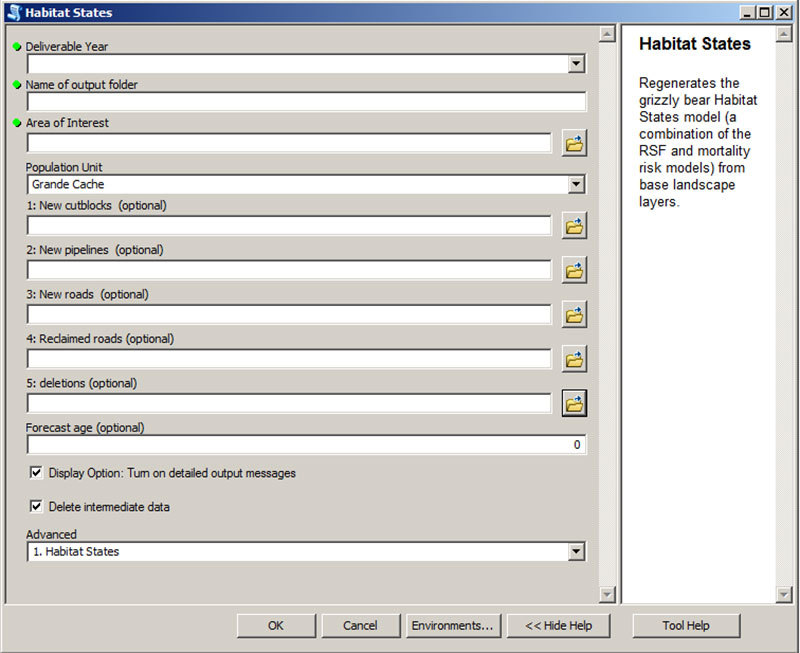
A manager can first run the Habitat States Tool to capture the current condition of the landscape. The same tool can be executed again with new additions such as roads, pipelines, wellsites and cutblocks which define the altered habitat. After executing these two runs, there is now data that tells a before and after story as two separate snap shots, but what now? How can we view and capture the change that occurred on the landscape?
This question got us thinking about new ways of providing habitat metrics and visualizations that capture the differences between two states. Over the past few weeks, we have developed a new Habitat States – Change Detection Tool that offers a repeatable way for mangers to run and understand where change occurred on the landscape and by how much.
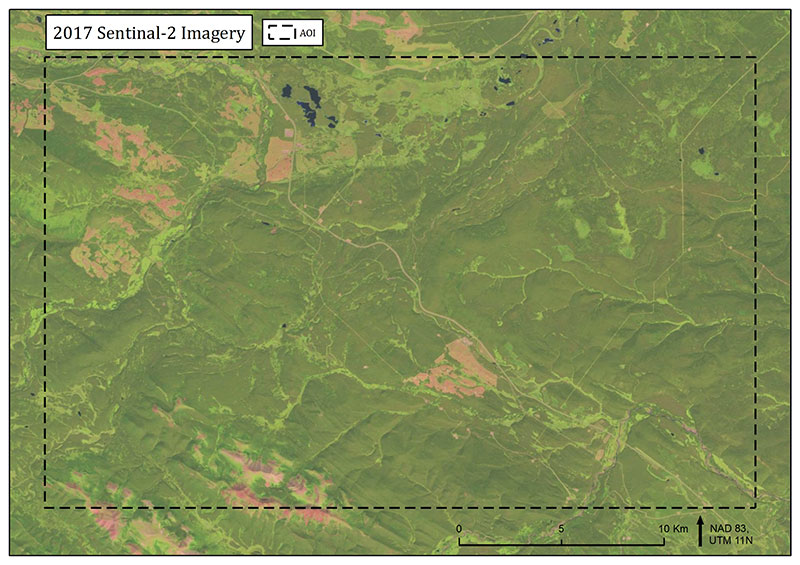
First, let’s run the Habitat States Tool for our area of interest (AOI) and capture the current grizzly bear habitat conditions. Below is what the landscape looks like from Sentinel-2 20m resolution imagery.
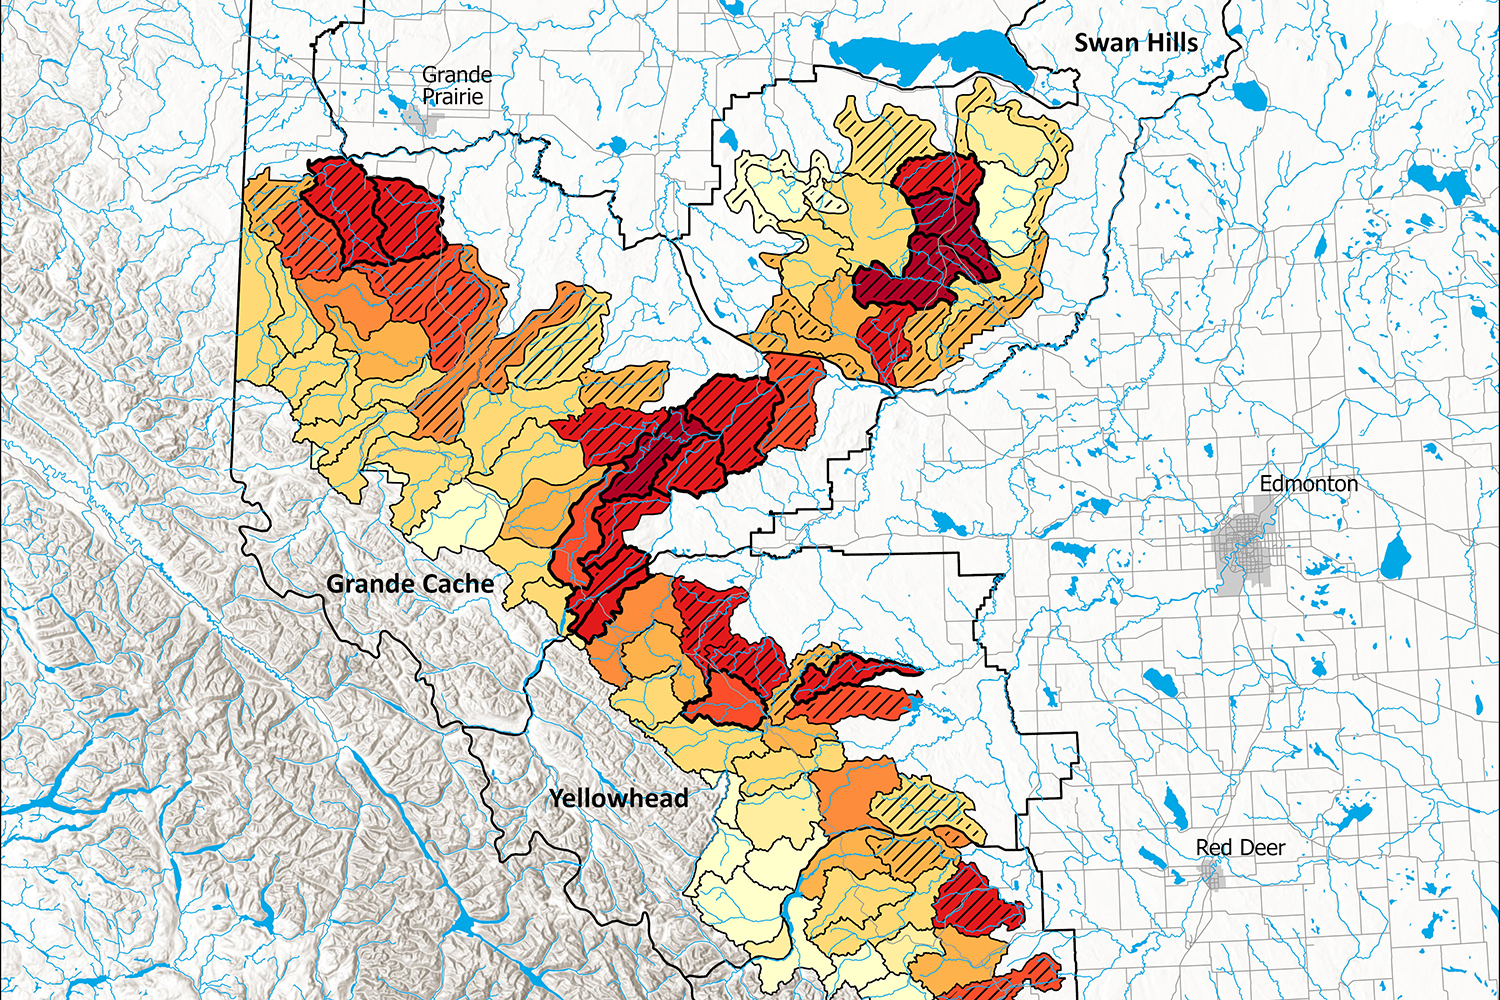
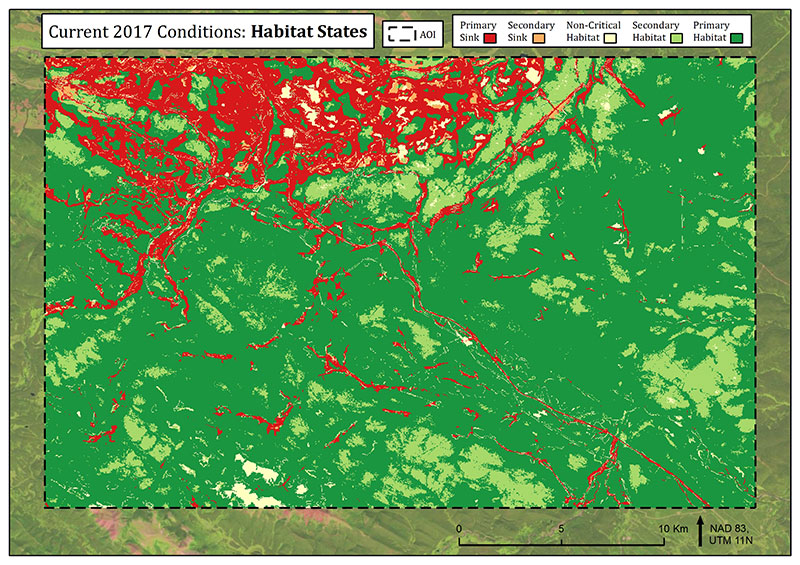
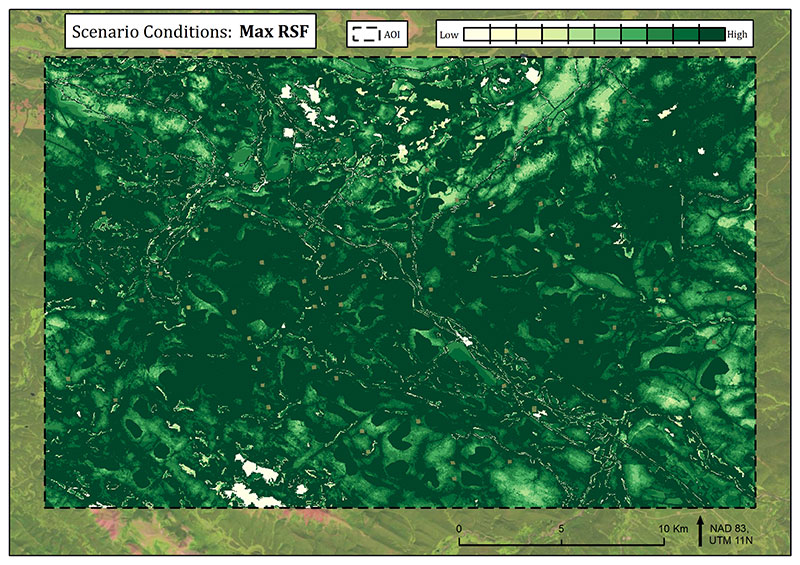
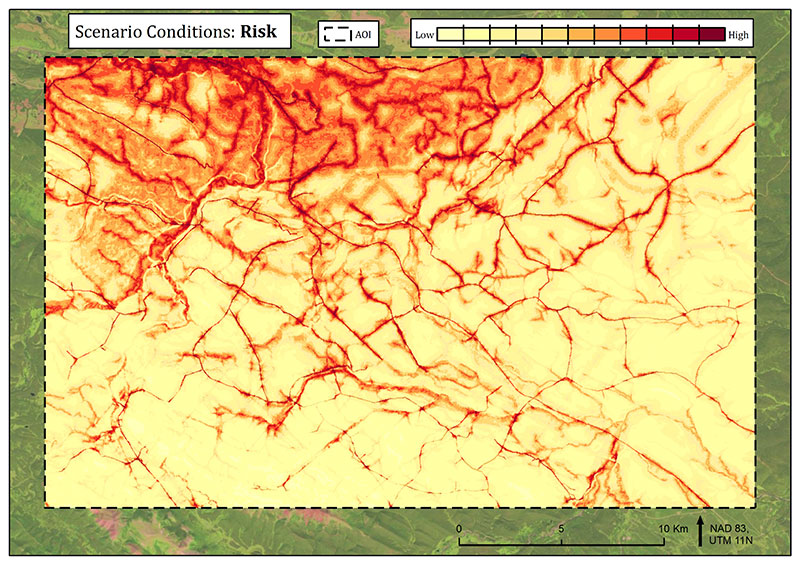
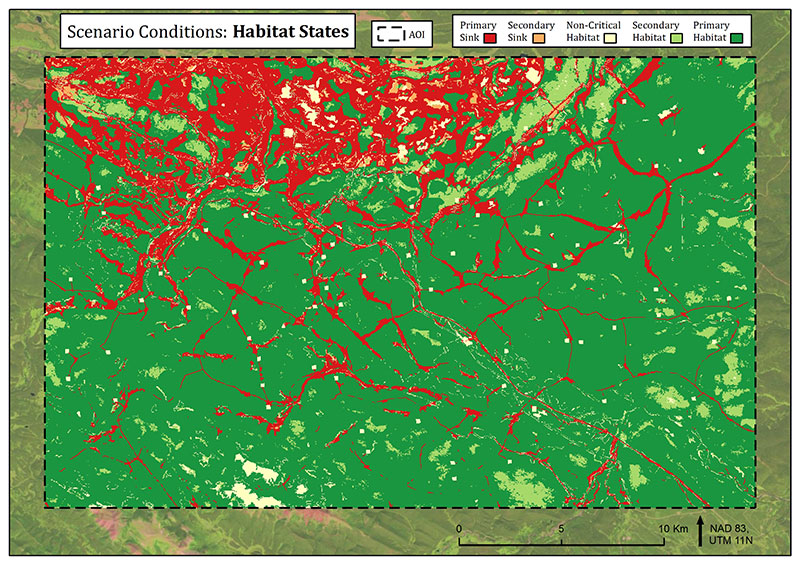
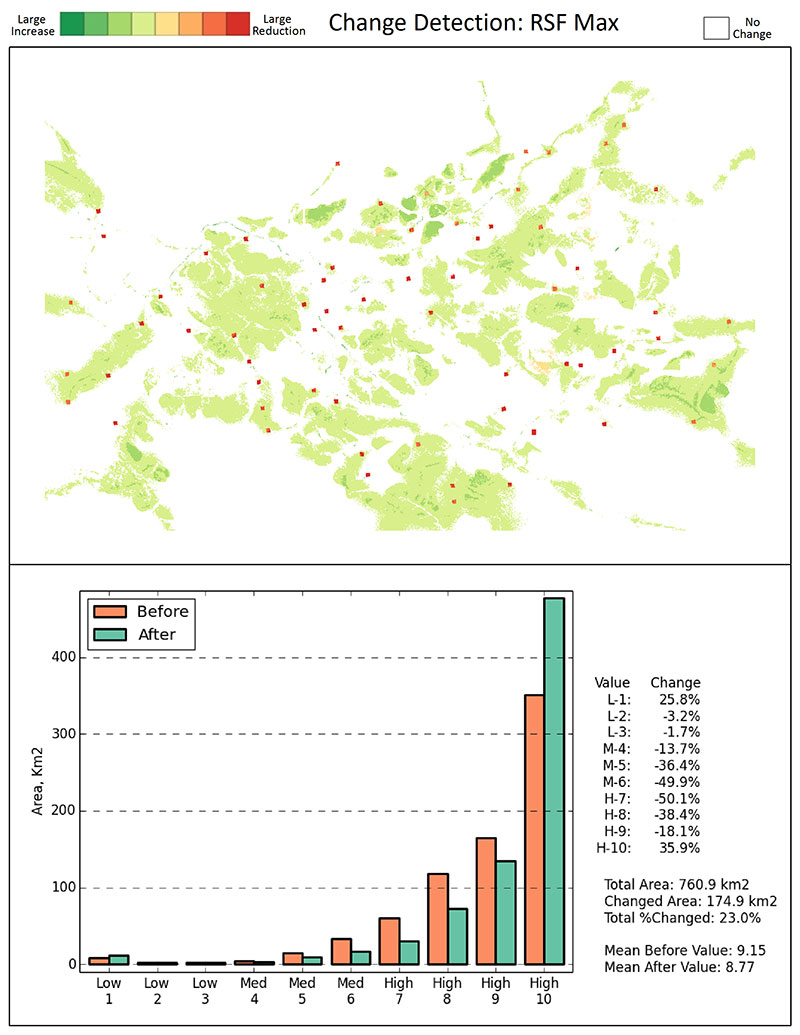
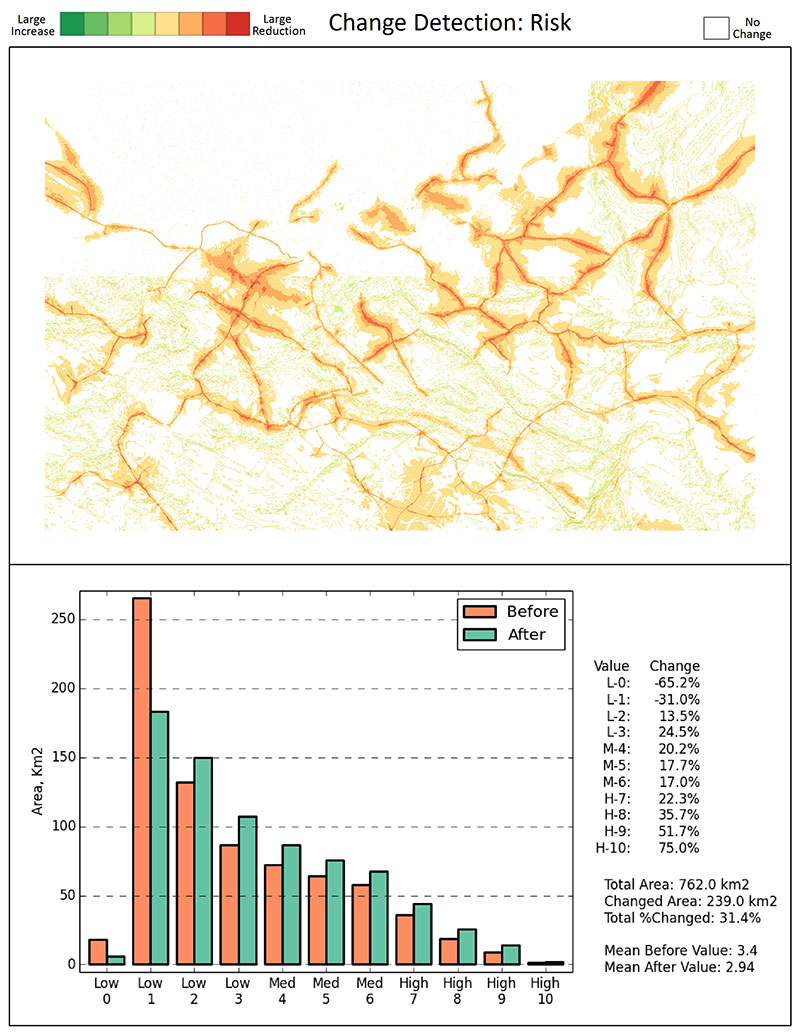
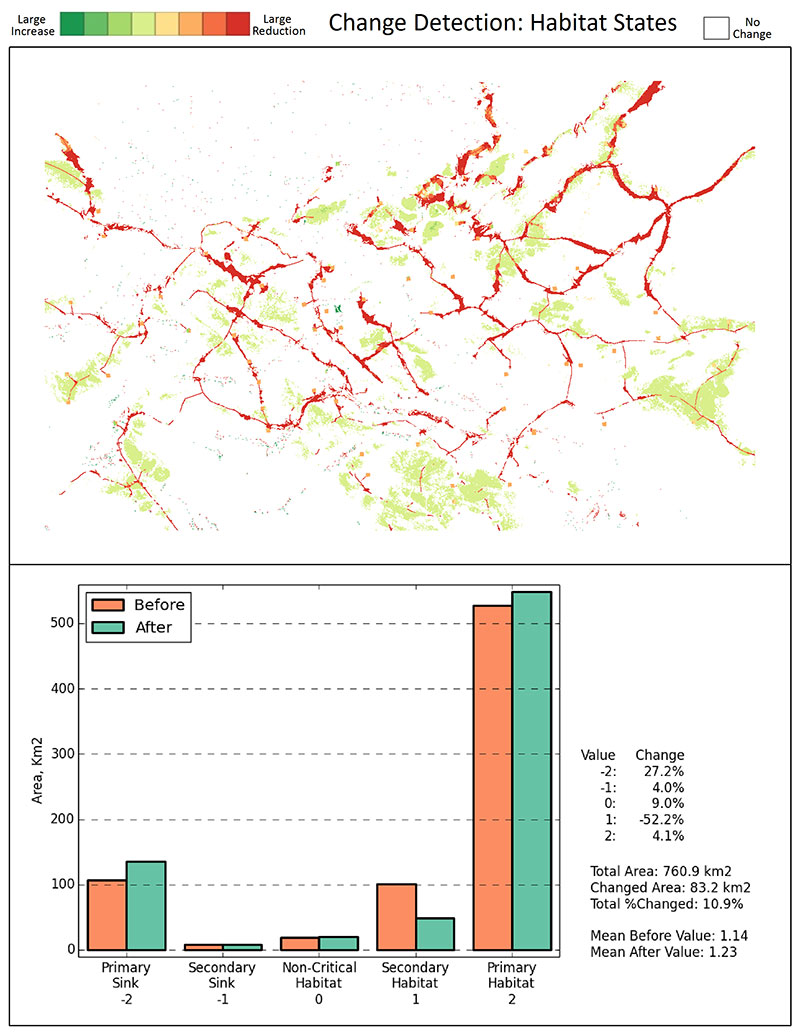
Now let’s look at the resource selection function (RSF) Max, Risk and Habitat State outputs generated from the Habitat States Tool. The RSF Max is a surrogate for habitat quality, Risk quantifies the security of the landscape from human-caused mortality and Habitat States combines the outputs from RSF and Risk to distinguish areas of population sink.


Now let’s introduce new footprint onto the landscape…
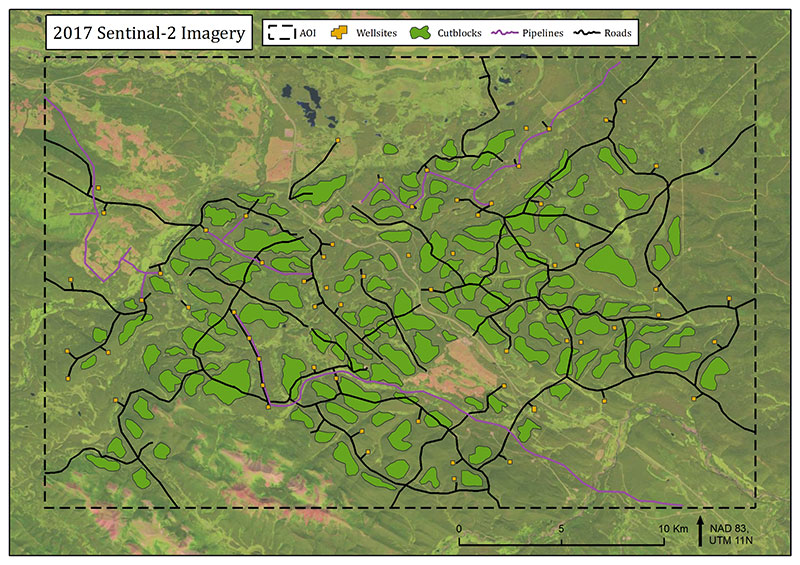
…and re-run the Habitat States Tool.
We now have our before and after snapshots of the landscape. Using the new Habitat States – Change Detection Tool we can compare our current and scenario data to understand where change occurred and by how much.
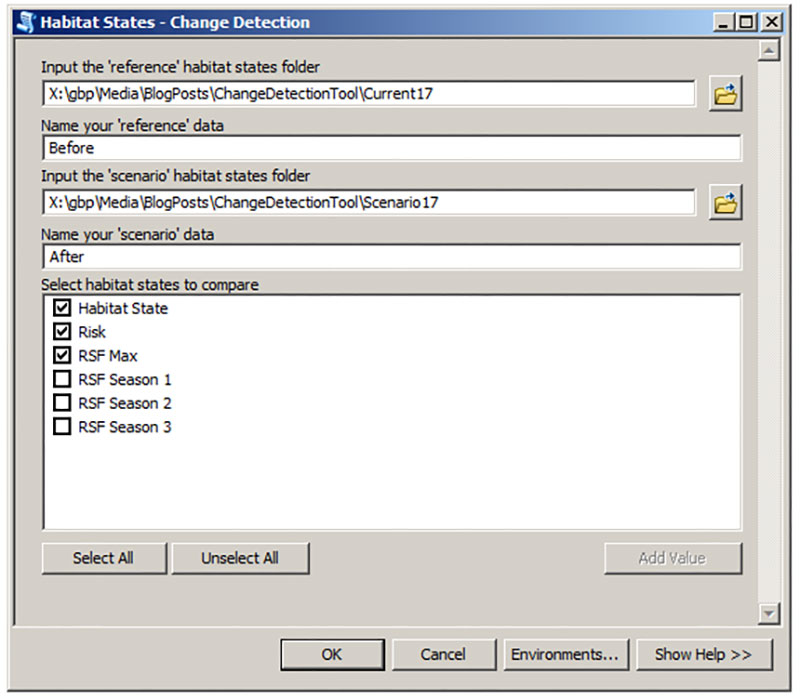
Image reports are generated that map where on the landscape change occurred and how much area of a particular value was changed between the before and after conditions.
Our goal is that this new tool will help answer those questions managers ask by quantifying habitat change in a meaningful way. We are looking forward to user feedback in order to modify and improve this new product—plan to see it in our next rollout of GBtools!