 By Dan Wismer, GIS Analyst
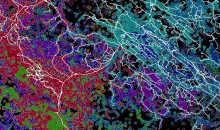
A good part of GIS work requires large landscape datasets to be filtered, processed and summarized into meaningful co-variates for statistical modeling and mapping. Measuring feature lengths, areas and counts is what GIS is good for but can be challenging when calculations need to be captured annually, over large areas and on large time-stamped datasets. For example, generating annual road densities within thousands of overlapping buffered grizzly bear GPS boundaries for each year from 1999–2019 can be a daunting task. First, buffered polygons need to be sub-setted by year, along with roads. Next, roads need to be clipped to each unique polygon zone and measured for length and density. Lastly, results need to be appended back to the original polygon and the work-flow repeated until all unique records have been processed.

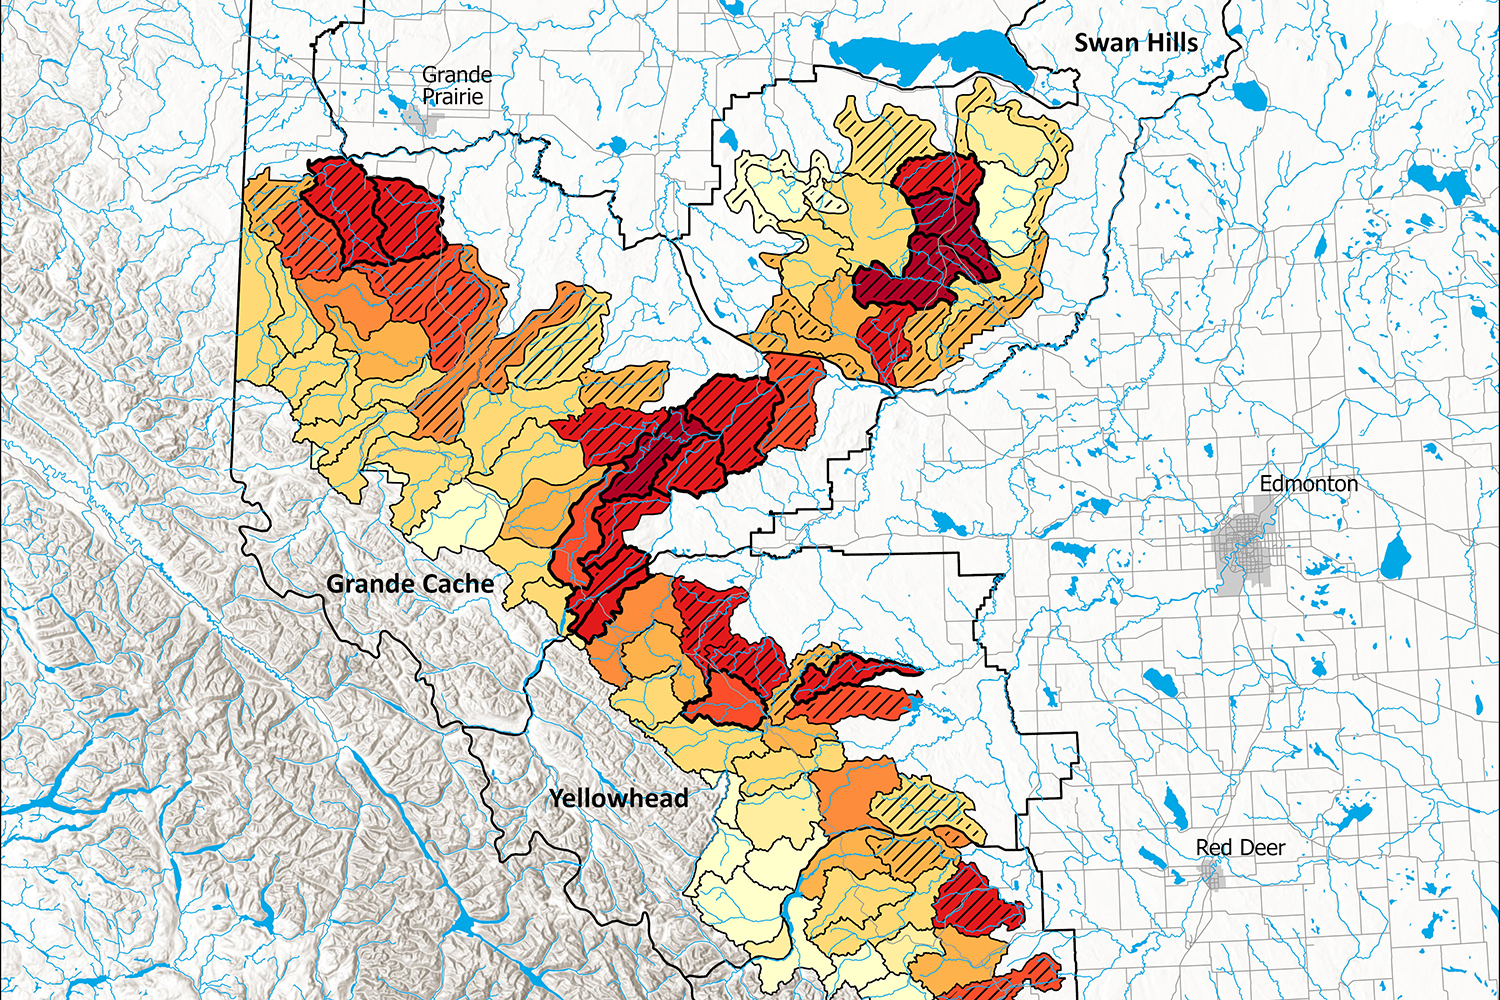
Roads atop annual grizzly bear buffered locations
A problem like this really needs an automated solution to help expedite the data summary process; turns out GIS and python is good for that too. Over the past weeks, we have developed new arcpy script tools that help streamline some of the more common data summaries and extractions to help make those daunting data analysis tasks into better time spent.
We are up to seven new tools that are ready for use:
Line Length and Density to Polygon Zones

Point Count and Density to Polygon Zones

Polygon Area to Polygon Zones

Polygon Attributes to Points

Raster Area to Polygon Zones

Raster Stats to Polygon Zones

Raster Values to Points

Each tool handles data summaries and extractions in a unique way, from calculating footprint metrics to summing up classified raster areas by zone.
The GIS program looks forward to creating more tools like these that help pull meaningful metrics from large and complex datasets. If you have more questions on the functionality of these tools or are interested in how they were coded, feel free to email me. Plan to see these new tools as deliverables for partners interested in data analysis.

