By Sonya Odsen and Mary Sanseverino
Landscapes in Motion is a project to improve the understanding of how, where, and when wildfires have occurred through Alberta’s southern Rocky Mountains. In this piece we scale mountains and step back in time with the Visual Applications team and discover how their participation helped improve the tools available to tell this landscape’s story.
Visual Applications team?
In the years since we launched LandscapesInMotion.ca, a huge amount of work has been done and the roles and objectives of some of the teams have evolved. The Visual Applications team (AKA the Oblique Photograph team) has ultimately produced a powerful end-to-end tool for analysing historical and modern oblique photographs from the Mountain Legacy Project (MLP).
An essential collaboration
The Visual Applications team is a unique collaboration within Landscapes in Motion. This team is made up of scientists and collaborators from the Mountain Legacy Project including Eric Higgs, Julie Fortin, Mary Sanseverino, Michael Whitney, James Tricker and more.
In collaboration with other Landscapes in Motion teams, MLP’s Visual Applications team developed an end-to-end process for visualizing, classifying, and quantifying landscape change using historical and modern photographs from this study area. The development of software like this unlocks the potential of MLP’s collection of oblique (ground-level) photographs, offering fire science researchers a look at the landscape in the Canadian Rockies as it existed over 100 years ago.
What is the Mountain Legacy Project?
The Mountain Legacy Project (MLP) explores all that changes in Canada’s mountain landscapes. Working with the world’s largest collection of systematic historical mountain photographs (over 120,000 from Canada’s Rocky Mountains), MLP researchers follow the footsteps of historic land surveyors to repeat photographs taken from mountain peaks. MLP scholars engage university researchers, managers, and practitioners in understanding how and why ecosystems, landscapes, and human communities change over time.
Harnessing the power of historical photographs
There are many techniques for learning about a landscape’s fire history and how it has changed over time. Dendrochronology, the main approach of the Fire Regime team, allows researchers to date past fires by analysing tree ages and fire scars—but the trees that document this history in their tree rings do not live forever, especially if they experience one or more fires.
Enter the Mountain Legacy Project and the Visual Applications team.
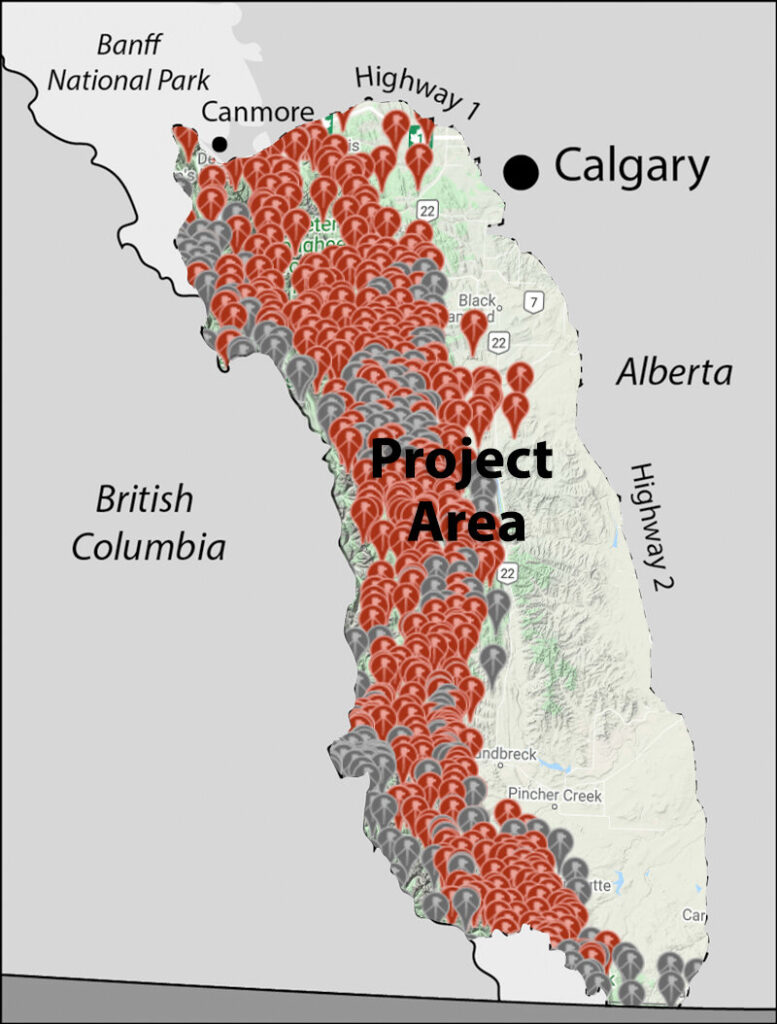
Carefully preserved photo negatives from land surveys—some taken a century ago or longer—provide a picture of the past that does not fade as trees die and decompose. And it just so happens the Landscapes in Motion study area is a region where MLP has an extensive collection of historical photographs from 1888 to the 1950s (Fig. 1).
The opportunity: developing new tools for documenting landscape change
Telling the landscape’s story using historical photographs is not a simple process. Analysing these black-and-white images to learn what, how much, and where different forest and land cover types occurred on the landscape requires sophisticated image analysis techniques.
In 2015, MLP had begun work on a visual application to help researchers explore, interpret, and discover meaning in the historical and repeat images in their collection. This application evolved into the Image Analysis Toolkit.
Working with Landscapes in Motion created an opportunity to build out this toolkit and create an end-to-end process that allows researchers to align historic and modern images, apply landscape classification categories to the images (also known as “masks”), quantify the on-the-ground extent of each class in an image, and more.
Figure 1 (Left). Map of the study area. Image courtesy of the Mountain Legacy Project.
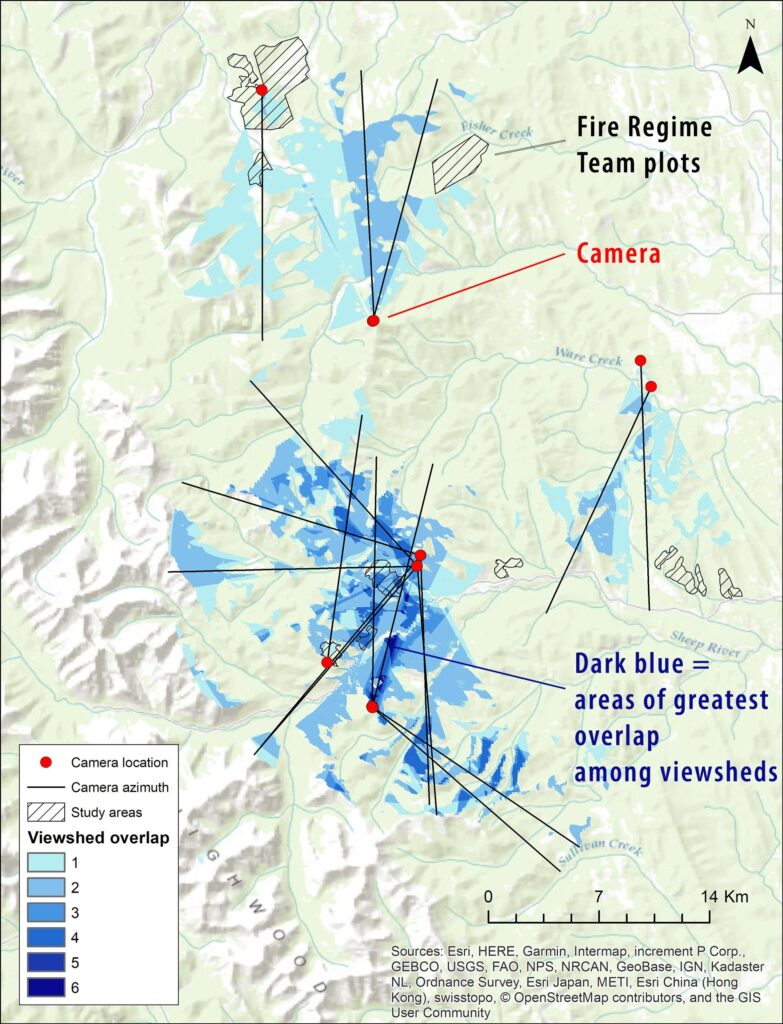
Figure 2 (Right). Map of the upper Elbow and Sheep River drainages. Areas with a deeper shade of blue indicate a high degree of overlap between the MLP viewshed and the Fire Regime team’s on-the-ground plots. Map courtesy of James Tricker, MLP Research Associate.
Comparing historical photos and modern repeats: what could be done before Landscapes in Motion
Before Landscapes in Motion, the Image Analysis Toolkit made it possible to:
1. align historical and modern repeat photos,
2. classify land cover types within the photos, and
3. count the number of pixels belonging to each cover type.
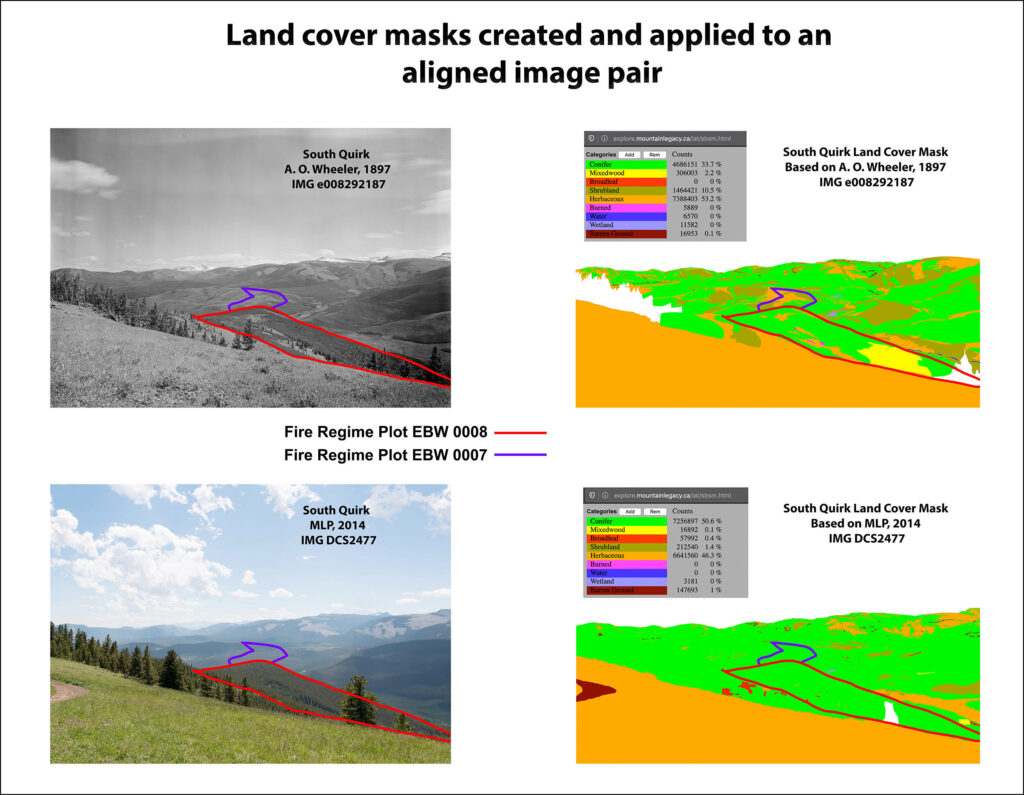
For example, in Fig. 3 below, land cover “masks” were applied to an aligned pair of images located not quite 20 km southwest of Bragg Creek (known as the South Quirk station). At first glance, some of the differences are obvious: in 1897, the forest was patchier and contained more areas of shrubland, grassy meadows (“herbaceous”) and mixedwood forest. In 2014, the landscape was more uniformly conifer forest, which had grown into many of the shrubby and grassy patches.
Fig. 3. Land cover masks created and applied to an aligned image pair in at the South Quirk station. The red and blue shapes indicate plots where the Fire Regime team collected on-the-ground data including tree cores. Image courtesy of the Mountain Legacy Project.
The methods used here have been used in other MLP study areas. In a different study in Willmore Wilderness, Julie Fortin compared 46 image pairs using this technique and found similar results: over time, the landscape became less patchy, and coniferous forest expanded to overtake areas that (in this case) were once alpine meadows and valley bottom wetlands.
Limitations of the old approach
However, this approach has its limitations. When analysing the oblique (ground-level) photos, scientists needed to account for the fact that pixels in the foreground and the background of the photo cover a very different real area. They were also only able to compare changes in ground cover in terms of the percentage area in the photograph—i.e., they could say that the ground cover of coniferous forest increased from 33.7% to 50.6% in the example above, but they could not make this comparison in terms of hectares.
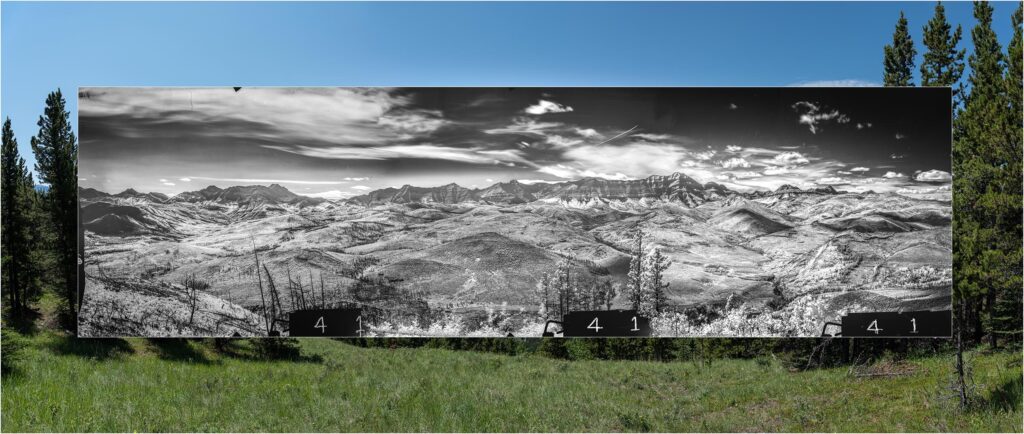
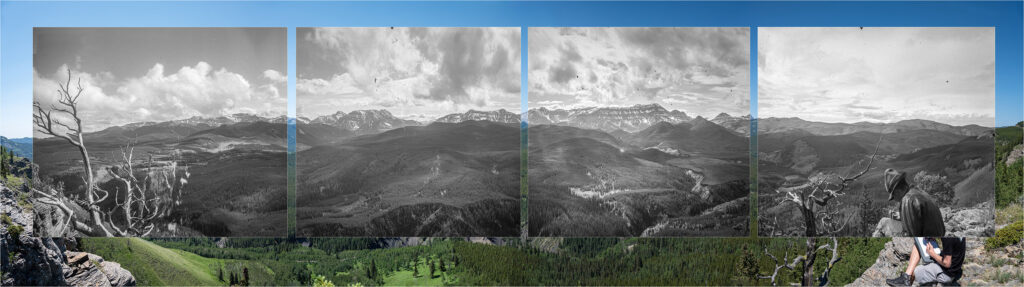
Looking westward from Missing Link Ridge over Gorge Creek and Sheep River toward the Rocky Mountains. Modern panoramic image (MLP, 2018) superimposed with historical photo taken by Rutherford Parlee in 1940. Historic images courtesy of Library and Archives Canada.
Extending the Image Analysis Toolkit: The South Quirk case study
These limitations have since been addressed through work conducted on the 17 photos identified above. For most of the photos, only the historical photos were analysed using the techniques developed with Landscapes in Motion, because these were of greatest interest to the Fire Regime team.
The new process: creating a georeferenced, masked viewshed
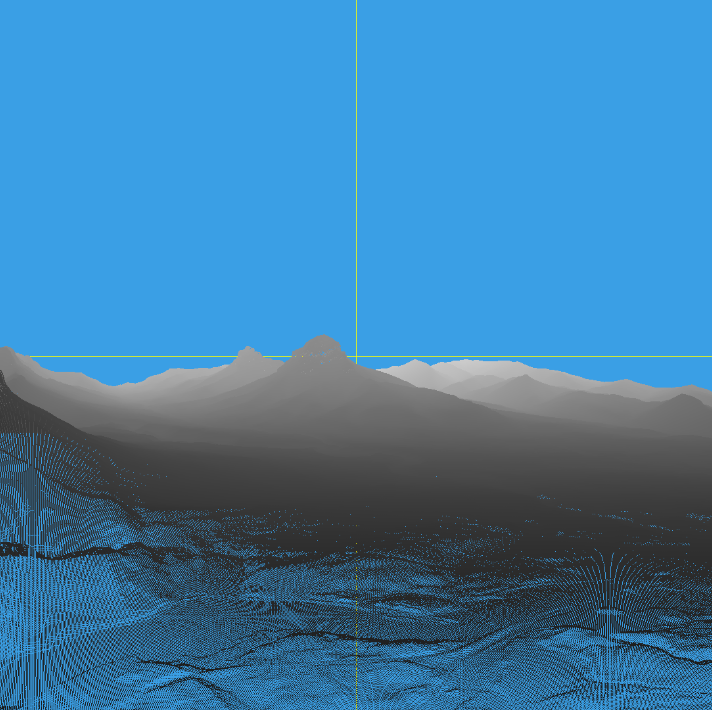
The new process has several steps, including building a virtual image (Fig. 4) and creating a georeferenced viewshed (Fig. 5). These steps make it possible to take a historical or modern photograph, calculate the area of land cover types, draw those areas on a map, and more.
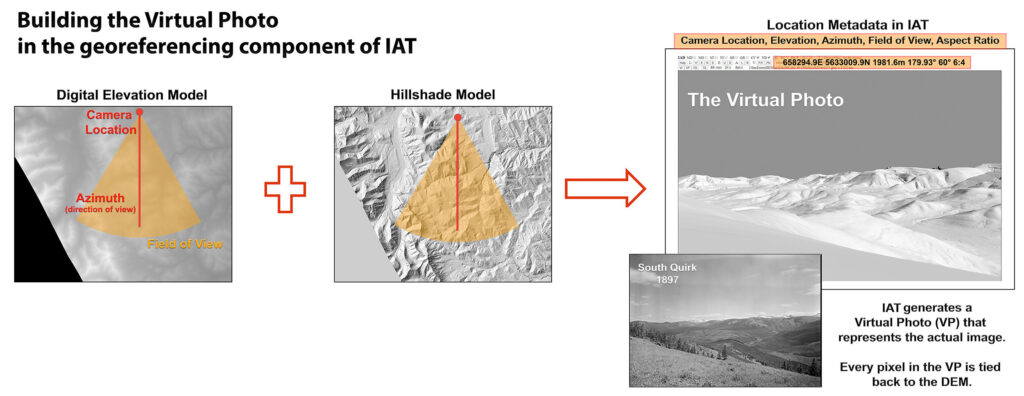
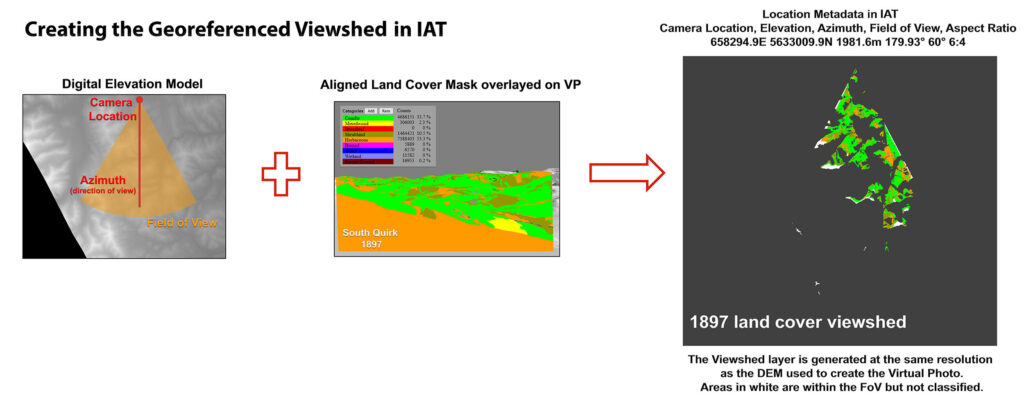
These new processes make it possible to take the pixels from a historical or modern photo and directly connect them with a location and land area (e.g., m²) on the map. This transforms what is possible using the Image Analysis Toolkit. It is now possible to calculate land cover types (like coniferous forest) in terms of hectares (Fig. 6). Additional steps were also taken to make it possible to calculate more variables like tree height and density categories (Fig. 7).
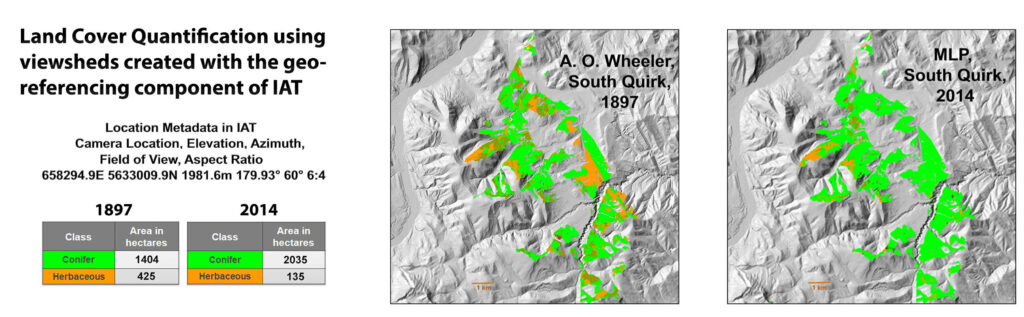
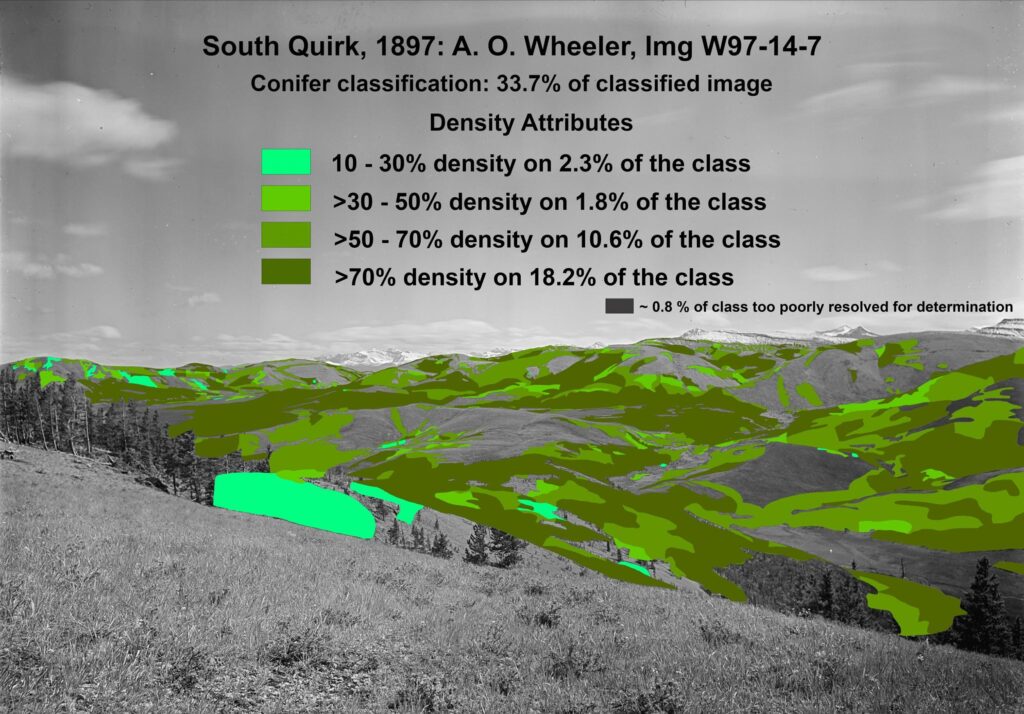
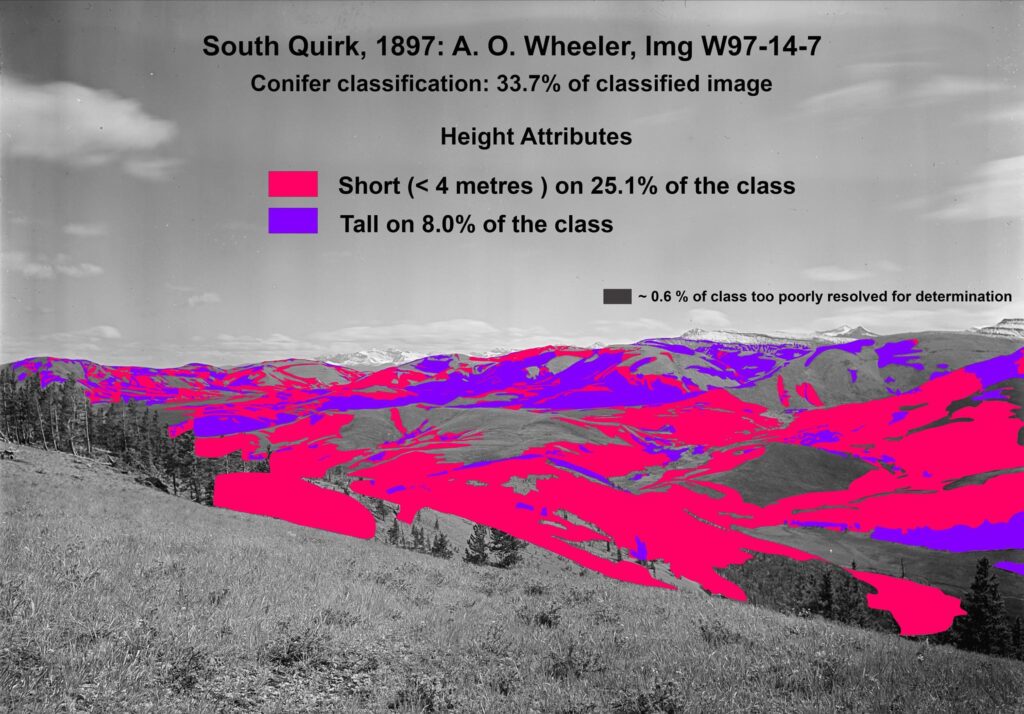
Figure 7. Historical photograph of South Quirk with masks showing conifer tree density classes (green) and conifer tree height classes (pink/purple). Each density and height class is expressed as a percentage of the total image, of which the conifer class makes up 33.7%. Image courtesy of the Mountain Legacy Project.
These new techniques make it possible to draw more, and more robust, conclusions about what this landscape looked like 100 years ago.
From the images above, we once again see the replacement of grassy meadow by coniferous forest, only this time we know exactly where on the landscape this change occurred. We can also see that in 1897, nearly half of the coniferous forest on the landscape was at densities lower than 70%. A great deal of these conifer forests were also short (less than four metres), suggesting that they were young and growing back after a disturbance—likely fire.
Taken together, these images analysed using the Image Analysis Toolkit tell a story of a landscape that was patchy and relatively young. As we will learn when we review the findings of the Fire Regime and Modelling teams, this is consistent with the kind of landscape expected to result from a mixed-severity fire regime.
Opening the door to new and exciting discoveries
The new Image Analysis Toolkit process can be used to help us understand how landscapes have changed over time using historical photos and modern repeats. But one very exciting outcome of this new process is how it can now be combined with data collected by the Fire Regime team to help us understand the processes that have shaped these landscapes over time, and how they interacted with each other.
The new analysis of historical photos is critical because it can help fill in the gaps created by fires. If the Fire Regime team has evidence of a fire somewhere, it is impossible to know exactly what the forest looked like before it burned because some or all of the evidence went up in flames. But if a historical photograph was taken some years before the fire, this end-to-end process makes it possible for the Fire Regime team to understand not only what kind of forest grew back after the fire but also what kind of forest was there before the fire. This is extremely valuable because understanding how fires shape forests is important, but equally important is understanding how forests shape fires.
This next step can be done by integrating location-based information from historic photographs with information from the Fire Regime team and from other sources. For example, landscape information from historic and modern photographs can now be added to a timeline of data including tree-ring samples, burn perimeters, air photos and satellite imagery. Importantly, the Image Analysis Toolkit is open access, meaning this kind of data integration will be possible for any researcher studying landscape processes in Canada’s Rocky Mountains, not just the fire regime team.
What comes next?
Artificial intelligence
Artificial Intelligence classification is another area full of promise for future research. Currently, image classification (i.e., determining which land cover types each region of the photo belongs to) is a manual process, taking many hours to complete. With a collection of over 120,000 historic photographs and almost 9000 modern repeats, the ability to automate image classification would open the door to huge volumes of information!
Indigenous burning
Centuries of Indigenous burning and land management were integral to shaping these landscapes and defining the wildfire regime they experienced. With MLP’s current toolkit, they can identify landscape patterns of recent burns, young forest, and forest openings, and are now working to see what can be learned about historic burn patterns and land stewardship by First Nations’ peoples. This is vital knowledge that can support the resurgence of Indigenous practices and potentially offer clues for contemporary stewardship of forested landscapes.
New graduate student Maya Frederickson has recently begun to understand what “spatial signatures” might correlate with historic Indigenous land stewardship. She is focusing on the LIM study area and working alongside the Stoney Nakoda First Nation. Her work is a direct extension of the Visual Applications team and is supported by the Canadian Mountain Network.
Other opportunities beckon. The ability to now create an “atlas of change” showing how the landscape appeared a century ago, and how it has changed, creates a platform for more effective forest management, conservation, and restoration.
The Image Analysis Toolkit is open access
It was a conscious decision to develop the Image Analysis Toolkit to allow for portability and wide access to the software. The Mountain Legacy Project research team is committed to making their work widely accessible for others to use both in association with the Mountain Legacy Project and in other oblique photo applications.
To learn more about and use the Image Analysis Toolkit, and to access the Beta with new features described in this blog post, visit http://mountainlegacy.ca/image-analysis-toolkit/
Sonya Odsen is an Ecologist and Science Communicator with a background in boreal ecology and conservation. She is a regular writer for Landscapes in Motion and is part of the Outreach and Engagement Team for the project.
Mary Sanseverino is a Research Associate with the Mountain Legacy Project at the University of Victoria. She is a member of the Landscapes in Motion Visual Applications Team. You can learn more about MLP at http://mountainlegacy.ca/.
Every member of our team sees the world a little bit differently, which is one of the strengths of this project. Each blog posted to the Landscapes in Motion website represents the personal experiences, perspectives, and opinions of the author(s) and not of the team, project, or Healthy Landscapes Program.