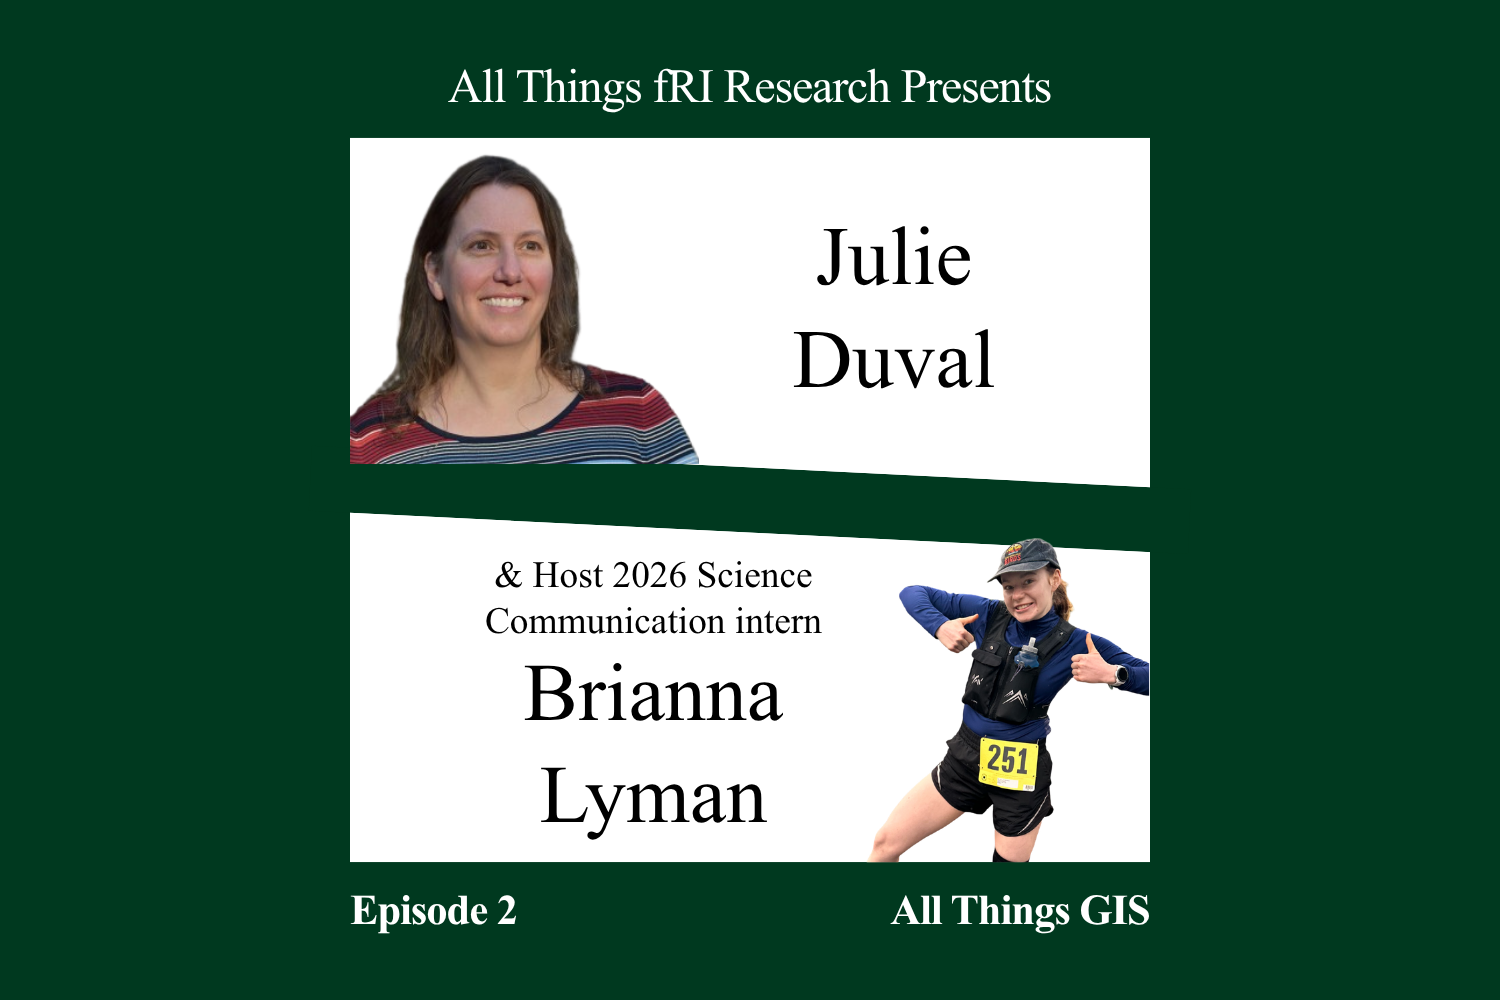
Julie Duval, lead of the GIS Services, provides an overview of GIS and gives examples of how its applications and capabilities have evolved over the years at fRI Research.
Transcript
Brianna Lyman:
Welcome back to All Things fRI Research. I’m your host, summer 2026 Science Communication intern Brianna Lyman. In this mini series, I’m bringing you stories across some of the organization’s research programs and technological services. Today’s conversation takes a closer look into GIS technology at fRI Research. We will be discussing what GIS is, how GIS services have evolved, and we’ll learn about the various applications of this technology — that we all just so happen to carry on our phones!
Let’s learn something new, starting with what GIS even is, with manager of GIS Services Julie Duvall.
Julie Duvall:
So GIS is an acronym for Geographic Information Systems, and it’s kind of the science of where, and it’s broken down into these simple graphic parts. So you have points, you have lines, and you have polygons. And these represent all kinds of things on on Earth, right? They all have a location and they all have attributes. So information tied to that location.
So an example of points. You could be map, having a point for each tree in your neighborhood. Or maybe it represents each city in your province or even a country. It could be represented as a point. The lines could be roads, railways, could be rivers. And then the polygons can be city boundaries. It could be a harvest block. It could be a lake. So all these things have a geographic location to it. So it’s got a place on Earth and it’s got information tied to it. So for example, a lake would have a name, it might have a type, what kind of lake? Simple things like that. Or it could be very complex, especially for a harvest block, for example, there might be a whole slew of different information tied to it.
And all these things they layer on top of each other and allow us to ask questions about what’s happening around us. And I think the greatest example of that is found on all our mobile devices. Every day we might ask, you know, I want to get A to B, especially when you’re driving and it just does it in the background. So that is GIS in everybody’s hand.
BriannaLyman
In wildlife research points can even be individual animal species. Points in fRI Research’s GIS projects have included fish and large fauna like grizzly bears.
Julie Duvall:
When I first started, we had a fish and watershed program, and they were getting inventories of fish in different streams, so they had point locations on those linear features. Which are your streams about the fish that they caught. And they release them, of course, it’s just to get an inventory of whether they catching the the bull trout or the other species, and they would get information about the length of that fish, the health and other kinds of attributes. And they would take all that information and put it into a big database that they can use later and in their analysis.
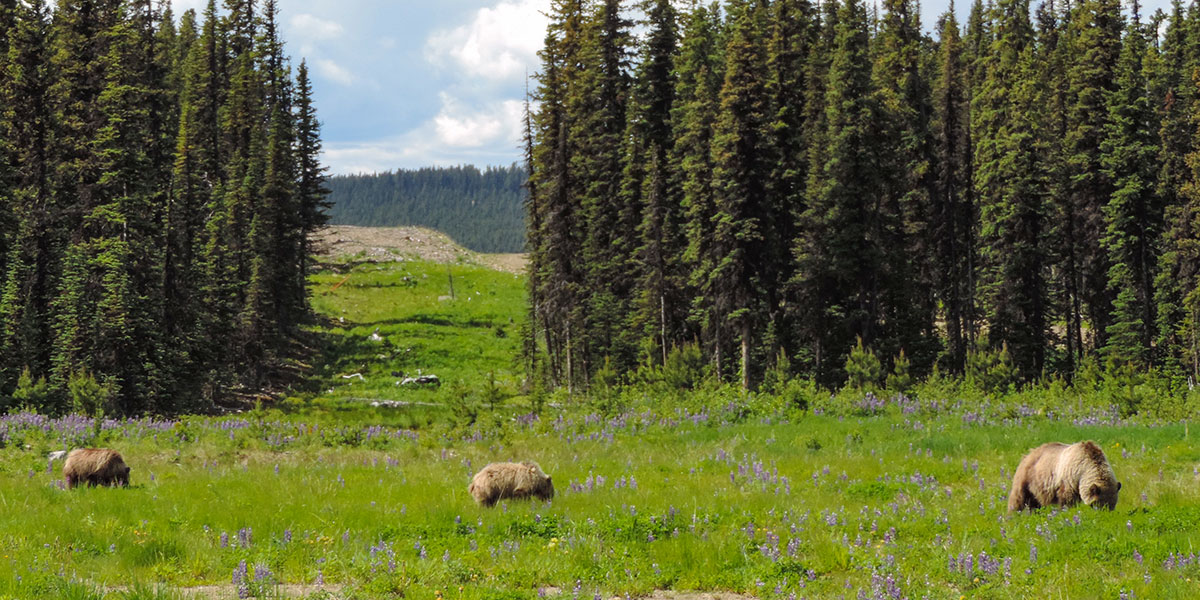
Another project is the Grizzly Bear Program, and they again use point locations to track where bears have traveled on the landscape. So these bears wear GPS collars which record an actual point sometimes every four hours, every hour, and they have been doing that for over 20 years. So we have a rich inventory of data.
Brianna Lyman:
With 25 years worth of data. One is going to need a powerful data management system.
Julie Duvall:
It’s not only mapping but also data management. So when they collect all this data, they need a way to be able to go back to it in an efficient manner and query it. So ask questions about it. Okay, well what happened? What was the trend in the last five years, last ten years, last 20 years? So an example is a grizzly bear, 25 years of data that they can query very specifically.
Okay. Where was this bear in this area between these years, for example. And there’s also DNA information where we have each bear has a unique identifier through their DNA. And we can determine, okay, well are any of these bears related. For example, is there do we know whose mother or father bear is for this one, an individual? So I’m probably going into much detail, but it’s just fascinating.
This is the stuff I love. I love dealing with data and putting them in in efficient databases or management systems so that it allows the user or the researchers to use it efficiently and ask the questions.
Brianna Lyman:
Beyond database management and mapping, GIS can be used to create tools. With all these different capabilities, Julie and GIS services support a range of diverse requests.
Julie Duvall:
So it can vary from just data extraction. So they say here are ten points. So ten locations on the map. And they need to figure out where on the landscape these points fall for example is it in a forested area. Is it in an agricultural, like a farming land or is it on the middle of the road, or is it in a residential area? So that those kinds of information can be extracted, or they want to know how close to a road does this location fall. So that is one of the typical requests.
Another one is like I said, the helping to build that map for publications. And then the other request, it’s not as common, but it’s more on going. So these are the tools that are built. They’re built with programing language within the GIS software that we use. And they’re quite extensive. They’re based on all the research that was done. And these tools are built so that they can be given to our partners, and they can run these tools on their end.
Brianna Lyman:
The biggest GIS tool made by fRI Research is their Grizzly Bear tools or GBtools. GBTools lets you put in a scenario – a forestry plan, road reclamation, a pipeline, etc. – and it calculates the effects on grizzly bear habitat quality, mortality risk, whether an area is compliant with disturbance regulations, and more. First published in 2007, the grizzly bear team and GIS services have kept the tool relevant by adding new data to GBtools over the years.
Julie Duvall:
There’s also data that support these tools, which are probably more complex than the programing part itself. Just because these tools spend so many years that you want to run the tools and the most recent data that you have. So we have to almost annually if we can but update the supporting layers because roads change, new blocks, new forests are harvested, new roads are created, new housing, you know, cities grow.
All these things changes on an annual basis so that we have to keep up to date with that. And it might sound simple, but it’s actually a lot of work to build these and update these data layers for these tools.
Brianna Lyman:
Just like the landscape has changed so has GIS services. fRI Research started off with just 2 GIS specialists, including Julie, supporting maybe 5 users with basic GIS knowledge on a mere 2 gigabytes of data. Over the past 20 years, GIS has exploded! We now have 16 terabytes of data which is HUGE and GIS has become much more user-friendly. Staff can now run their own GIS analyses and even create their own GIS products.This change has shifted how Julie supports the GIS product making process and has allowed her to focus more on the ‘art’ and ‘communication’ of GIS.
Julie Duvall:
It’s a process of okay, well, what data do we have? What can we do with it? So this is where I would come in and help them figure out what’s the best way, whether it’s building a tool that uses programing language. Or maybe it could be as simple as creating a story map to show the processes. And sometimes it could be those infographic posters that might require a map or two where I can again help create those maps, those maps itself, there’s kind of an art to them because you want to convey the correct information, right? Because you can do so much with maps. But sometimes if it’s, if there’s too much information on it or incorrect information or it’s just not displayed, the message that you’re trying to say, it doesn’t work. So my job is trying to utilize the tools, whether it could be simple as the different colorings, the symbols used for points, the thickness and colors of lines, and the type of lines all these little things put together can make or break them up really. So your end goal is you want to convey the message that you want to give to your audience.
Brianna Lyman:
GIS is certainly a powerful storytelling tool. To explore some of these place-based stories check out the GIS Products section under our websites Publications and Media tab. We are thankful to GIS Services manager, Julie Duval, for sharing her knowledge and enthusiasm about GIS with us today. We hope you learned something new and will tune in for our third and final episode of All Things fRI Research to experience the point of view of Grizzly Bear biologist, Kirsty McFadyen. Till then, this was your host, 2026 science communication intern Brianna Lyman, signing off!