By James Tricker
[This post also appears on the Mountain Legacy Project website.]
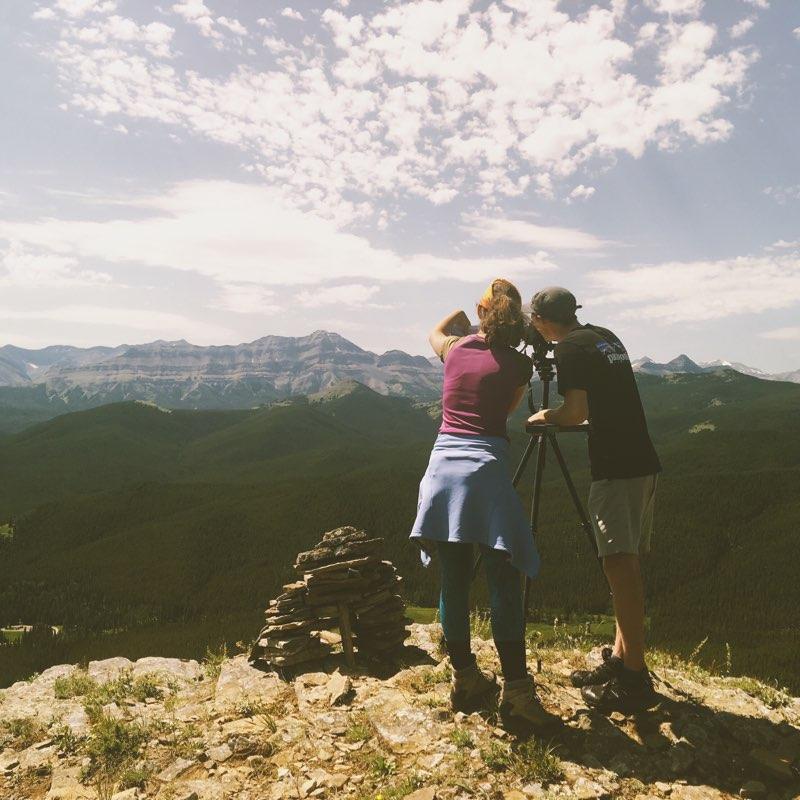
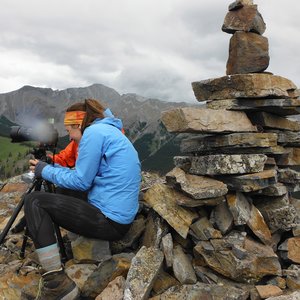
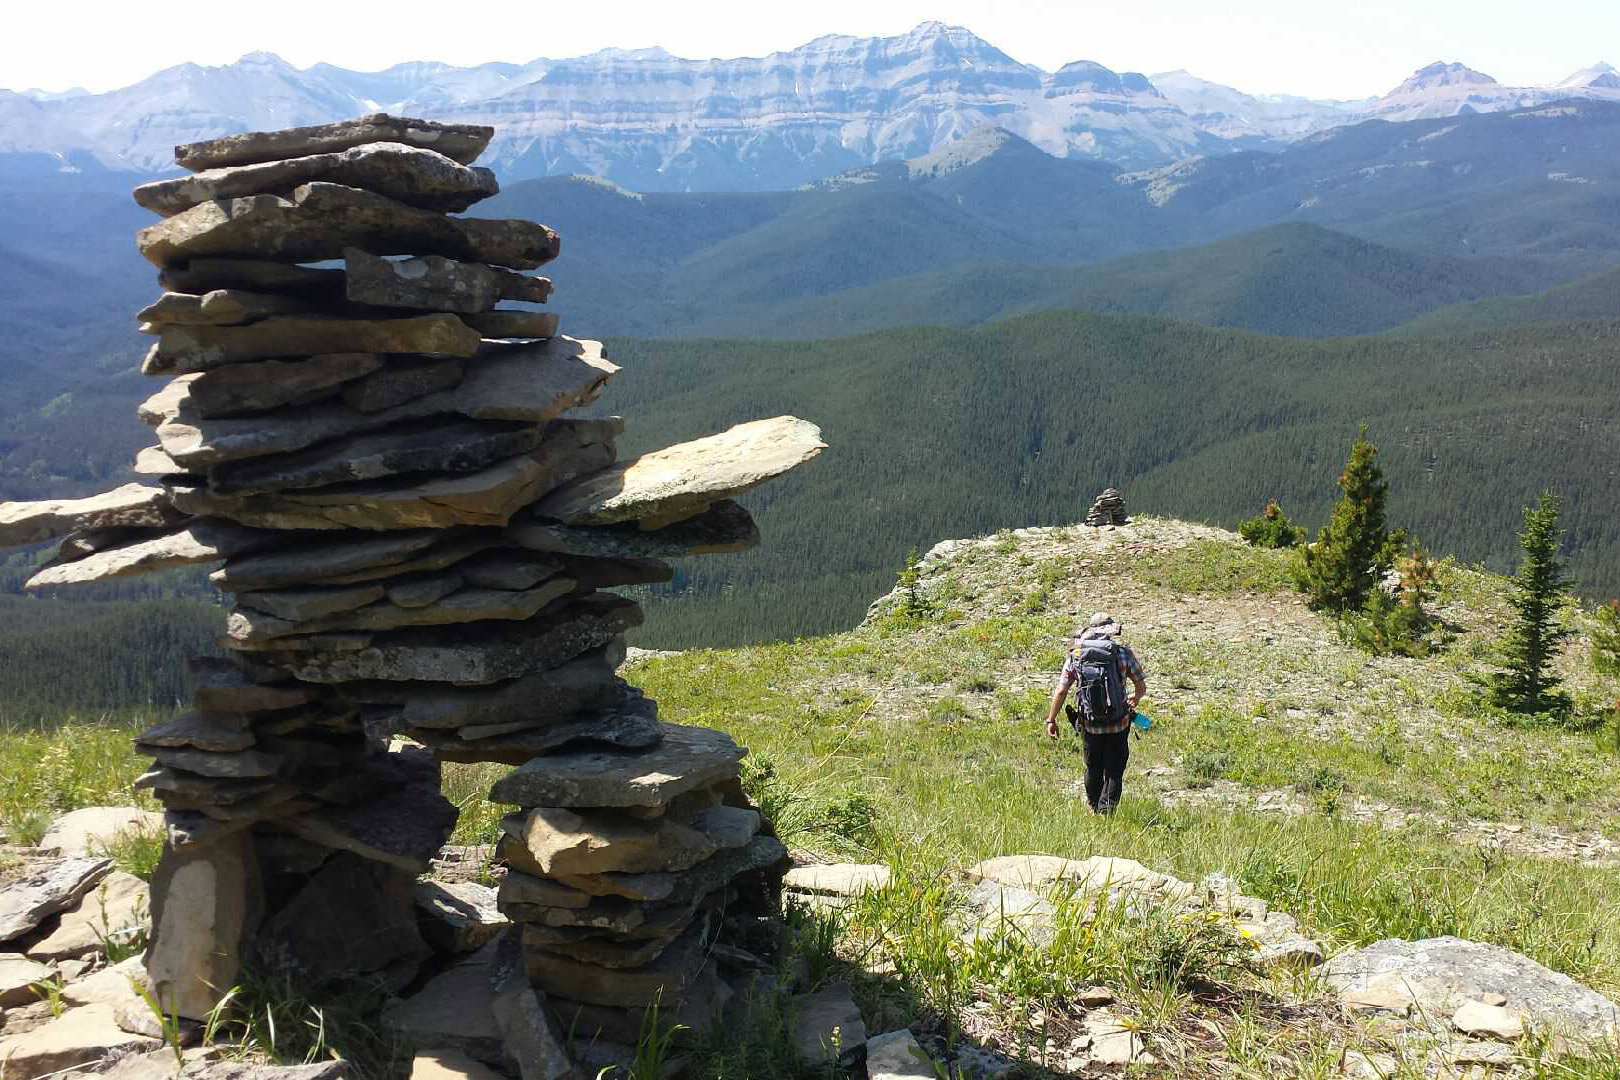
The Landscapes in Motion Oblique Photography Team has the daunting task of scaling mountains to repeat photographs taken up to a century ago by land surveyors. In previous posts we’ve described how these intrepid researchers locate sites, line up their photos, and what it’s like working in the field. With the Landscapes in Motion teams now analyzing data and sharing the results, our teams are starting to explore new ways of collaborating and combining datasets. Here we share some insights on the process from a collaborator with the Oblique Photography Team, Mountain Legacy Project researcher James Tricker.
What are viewsheds, and why use them?
The Mountain Legacy Explorer website provides a map-based tool for investigating Mountain Legacy Project (MLP) collections. Users click on camera station locations overlaid on a base map to view the historic and repeat photographs. That’s right – you can click on a map and instantaneously see a photo of that area from as much as 100 years ago!
While the MLP mapping tool is an exciting and innovative way to journey back into the past, there are still a few tweaks needed to make it more useful for researchers. What is missing presently is a way of showing the direction the camera was facing and the angle (or field) of view. This creates a challenge for users, because they need to know the landscape in order to know which direction particular images are pointing.
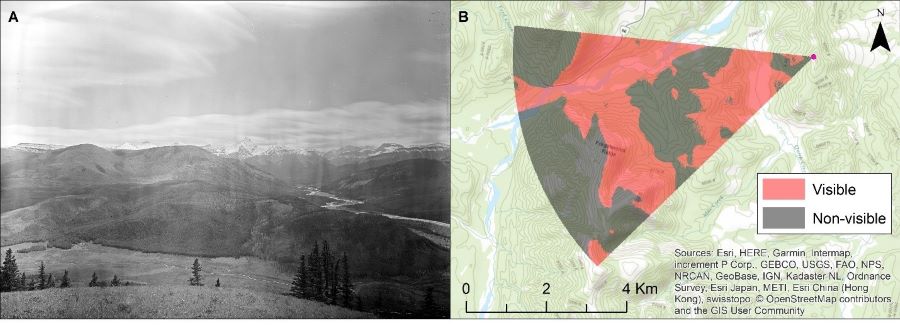
The solution to this issue is to develop a viewshed for each photo. A viewshed depicts the amount of visible terrain in each image based on the direction (or azimuth) of the camera, its field of view, and the shape (or topology) of the landscape (Figure 1).
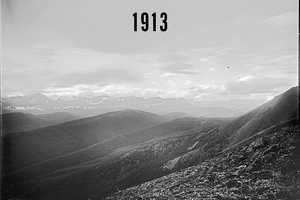
The historic surveyors were well aware of viewsheds. They recorded the azimuth (bearing taken between camera location and known landscape feature) and other angular measurements for each image. The images and measurements were then used to create accurate topographic maps of mountainous regions in Western Canada. They solved the problem of hidden portions of the landscape (e.g., terrain hidden behind a ridge) by looking back on the same landscape from another camera station. In theory, and mostly in practice, the photographs established nearly complete coverage of survey regions.
Knowing the viewshed of an image is important for many reasons. For many users, being able to visualize a viewshed opens up the MLP collection for speedier examination of specific features. Imagine a rollover feature that allows someone to see immediately which images point in a direction of interest, and to zero in on those views (we’re not there yet!). For researchers investigating landscape change there are two reasons why viewsheds are important. First, they provide a general overview of the terrain, which aids in selecting image pairs they want to analyze in their research study areas. Second, and more elusive, viewsheds show how much of the landscape they are interested in is depicted in the image. For example, does the camera station viewshed depict the entire landscape in the image, or are there areas in the image that are obscured by the landscape topology?
Developing viewsheds for Landscapes in Motion
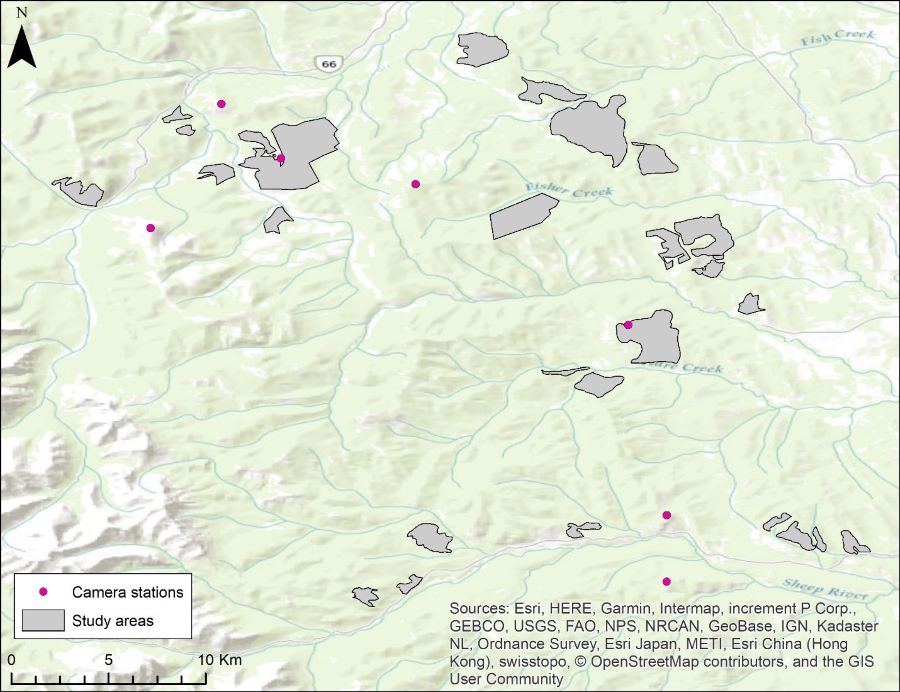
Dr. Cameron Naficy, a researcher on the LIM Fire Regime Team, recently reached out to MLP researchers to collaborate on an exciting new opportunity to learn more about the wildfire history of Alberta’s Foothills. Because MLP has several camera stations positioned around the LIM study area (Figure 2), there was the chance to bring together insights from MLP photo pairs (for example, changes in vegetation) with Dr. Naficy’s knowledge of wildfire – but only if we could figure out the viewsheds of these photos and where they overlap with LIM field sampling locations.
The process for developing a viewshed map involves the unglamorous but essential preparation of the camera station data for analysis, and then importing these data into a Geographical Information System (GIS) and running the viewshed analysis. These data refer to the location (coordinates) and azimuth of each image.
In the early years of the MLP, azimuth information was not recorded at all – it was only in the last decade or so that the azimuth was recorded for each image. As many other researchers can likely tell you, though, older data measurements may lack the accuracy required for use in newer types of analysis. A big part of our team’s process was, therefore, to correct these azimuth measurements to bring them to the level of accuracy needed for this project. An MLP student research assistant, Hanna Schmidt, was instrumental in developing novel techniques using Google Earth to assess the accuracy of the camera station data and make corrections as necessary.
The final product: an interactive viewshed tool
Once the data are corrected, they are imported into a GIS. The GIS viewshed tool is straightforward to use, and provides a wide variety of ways for our team to set the right parameters. For example, we can change the ‘height’ of the observer (called observer offset) if there is vegetation obscuring the camera’s view in some of the repeat photos.
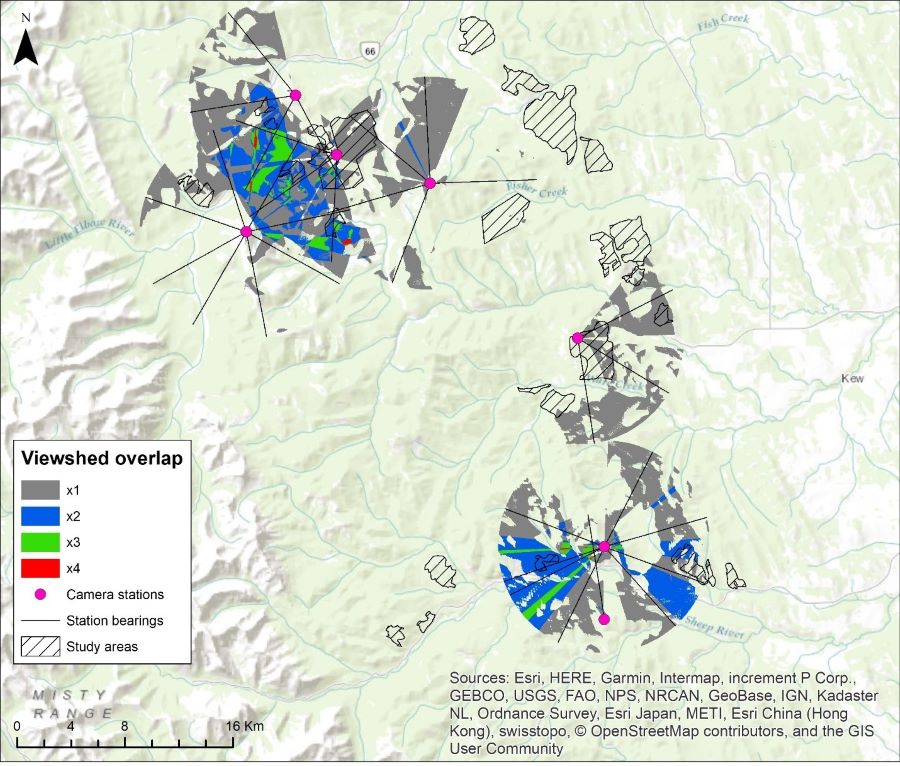
The resulting viewshed map depicts the combined viewshed coverage for all the available camera stations within 10km of the study area (Figure 3). This map will be used to identify study areas that are fully represented by camera station images.
Most of the camera station viewsheds “overlap” with adjacent stations, as indicated by the colors in the map legend; sometimes as many as four viewsheds overlapped the same area (i.e., x4 overlap)! For certain study areas with these large amounts of viewshed overlap, it was difficult to determine how each image was contributing to the combined viewshed coverage. Therefore, individual viewsheds (like our first example in Figure 1) were calculated for certain camera stations to determine what areas of their output contributed to the combined viewshed coverage.
Bringing it all together
This work has exciting implications for the next steps of the LIM study program. By determining viewsheds that overlap with the LIM sampling sites, a whole host of opportunities to combine the power of Dr. Naficy’s data and the MLP dataset are opened up. For example, because severe fires can destroy much of the on-the-ground evidence that Dr. Naficy and his team rely on for determining fire history, the MLP photos can serve as an important “check and balance”: LIM fire researchers can look at MLP photos that were taken soon before or soon after major fires, helping them to verify their understanding of the effects of that fire on the landscape. In some cases, these photos can be powerful tools to help researchers reject or confirm hypotheses about the history of the landscape.
The next steps
The process for generating viewsheds presently requires intensive manual corrections of the camera station data. In the future we hope to shift to automatic viewshed generation, which will involve changes to field data collection and software processing. Eventually, when a computer mouse hovers over an MLP station in the Explorer app, a series of viewsheds will automatically appear to guide the viewer’s selection of images. This work is a first step along that path.
Every member of our team sees the world a little bit differently, which is one of the strengths of this project. Each blog posted to the Landscapes in Motion website represents the personal experiences, perspectives, and opinions of the author(s) and not of the team, project, or Healthy Landscapes Program.